Technical problems can really slow things down. It’s important to know if the issue is with your setup or a bigger problem.
Knowing how to check if services are down can make a big difference. This guide shows you how to see if services are working on different platforms.
We’ll look at simple ways to fix IT problems. These methods help you figure out if it’s just your network or a bigger issue.
Learning how to diagnose problems quickly can save a lot of time. We’ll cover everything from quick checks to detailed investigations for different platforms.
Understanding System Downtime and Its Common Causes
System downtime is more than a short-term problem. It’s a complex issue with many possible causes. When systems go down, it affects both organisations and users. Knowing the system downtime causes helps in fixing and preventing problems.
Hardware failures are a big reason for downtime. Things like storage devices, memory, and processors can fail. Power supply units and network cards can also stop working. These issues need quick fixes to avoid big problems.
Software problems are another big cause of downtime. Crashes, conflicts, and bad updates can all cause outages. Memory leaks and driver issues can also make systems slow or crash.
Network issues are hard to deal with because they affect how systems talk to each other. Router and switch problems, plus cable damage, can cut off whole areas. Network errors and too much traffic can also cause big problems.
Things outside our control can also cause server problems. Power outages, natural disasters, and accidents can all damage systems. Internet issues and attacks can also block access.
The effects of downtime vary. Short outages might just annoy people, but long ones can cost a lot. Systems like healthcare and finance need to be up all the time.
Knowing why systems fail helps us fix them. Regular checks and updates can prevent hardware problems. Testing software and having backup networks are also key. This knowledge turns random issues into things we can solve.
This knowledge is key for checking system status. The next parts will show how to keep an eye on systems and fix problems.
Are the Computer Systems Down: Initial Quick Checks
When systems seem unresponsive, quick checks can save a lot of time. These quick system checks help figure out if problems are local or system-wide.
Testing Basic Network Connectivity
Network issues often cause system downtime. Start your immediate diagnostics with these simple steps:
- Open Command Prompt and type “ping 8.8.8.8” to test internet connectivity
- Use “tracert google.com” to identify where connections might fail
- Verify network settings through Control Panel > Network and Sharing Centre
These basic troubleshooting steps help find out if the problem is with your device or the network.
Inspecting Local Device Indicators
Windows Security has device status indicators in its Device Performance & Health section. This tool gives insights into four key areas:
| Health Category | Purpose | Recommended Action |
|---|---|---|
| Storage Capacity | Monitors available disk space | Free up space if below 10% |
| Battery Life | Checks power management issues | Review power settings if excessive drain detected |
| Apps and Software | Monitors for failures or updates | Update or reinstall problematic applications |
| Windows Time Service | Ensures clock synchronisation | Verify internet time server settings |
Regularly checking these indicators is part of essential quick system checks. It helps prevent many common problems.
For detailed immediate diagnostics, combine these local checks with your network connectivity test results. This gives a full view of your system’s status before moving to more complex troubleshooting.
Leveraging Online Resources for System Status Verification
When local fixes don’t solve computer problems, online tools are key. They help figure out if issues are just yours or a bigger problem. These services show service health across different platforms and networks.
Top Websites for Monitoring Service Status
Many websites offer great monitoring tools. UptimeRobot is a top choice. It gives 50 free monitors and supports over 20 platforms.
It sends alerts right away through the web and mobile. This means you know about service issues fast. UptimeRobot checks:
- Website and response time
- DNS and SSL certificates
- Domain expiration
- Cron jobs and ports
- Ping and keywords
It’s great for both personal and work use. It gives deep insights into system performance.
Analysing Status Reports and Outage Maps
Big service providers have public status pages. Microsoft’s Service Health dashboard is a good example. It’s in the Microsoft 365 admin centre.
The dashboard shows service issues clearly. It uses colours and links to detailed reports. Each service’s health is shown in a table.
When looking at these dashboards, focus on:
- Service health indicators (green for normal, yellow for degraded, red for down)
- Incident start times and when they’ll be fixed
- Affected services and where they are
- How services have performed over time
Knowing how to read these helps spot local problems versus big outages. This saves time when fixing issues.
Many dashboards also have outage maps. These maps show where problems are. They’re useful for finding issues in your area but not elsewhere.
Step-by-Step Guide: Checking System Status on Windows
When your computer has issues on Windows, checking it step by step can help find the problem. This guide will show you how to use built-in tools for a deep system check. It will help you see if your computer is working right.
Utilising Task Manager for Process Monitoring
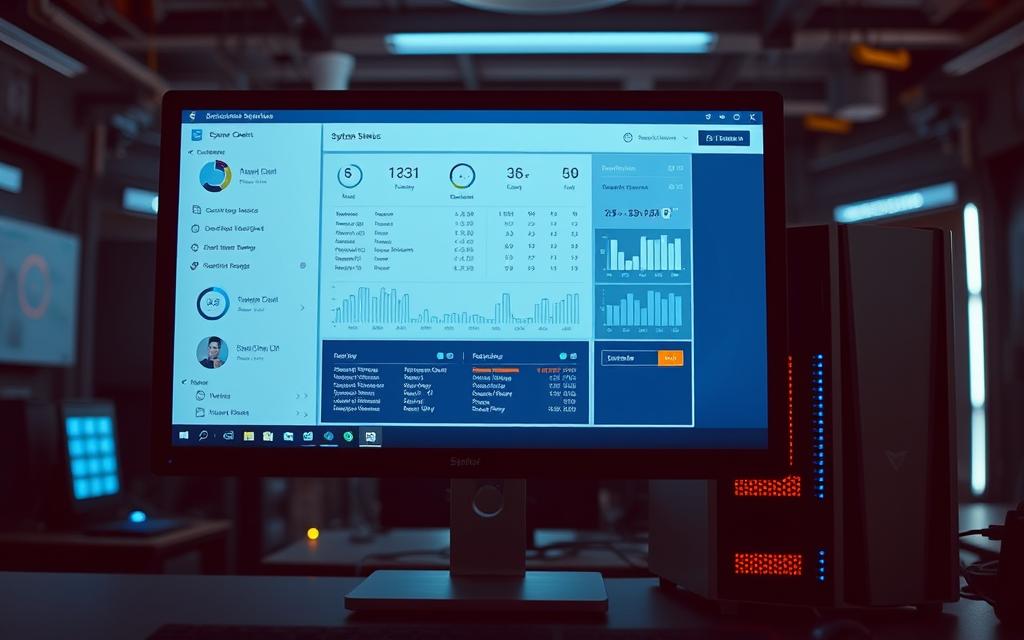
Task Manager gives you live updates on how your system is doing. You can open it by pressing Ctrl+Shift+Esc or by right-clicking on the taskbar. The Processes tab shows all running apps and background tasks.
Look at CPU, memory, disk, and network usage percentages. High usage might mean your system is slow. Find out which apps are using a lot of resources and slow down your system.
The Performance tab has detailed graphs for each part of your system. Watch for unusual spikes or high usage patterns. This Task Manager monitoring helps find and fix problems fast.
Reviewing Event Viewer Logs for Errors
Event Viewer is like your system’s diary, recording important events. Find “Event Viewer” in the Start menu to open it. The Windows Logs section has several key categories.
Look at Application and System logs for common issues. Filter logs by level: Errors and Warnings need your attention. Each log entry gives details about what happened and when.
These Event Viewer logs often have error codes for solutions. Regular checks help spot problems before they get worse.
For full Windows diagnostics, try the Security health report feature. It shows colour-coded status indicators:
- Green check: All systems working fine
- Yellow mark: Issues to look at
When problems are found, pick items to see Microsoft’s advice. Performance issues lead to tips for better performance. Storage problems offer ways to free up space.
Make sure your Windows is up to date with Windows Update. Regular system process checking and upkeep keeps your computer running well. It also stops unexpected downtime.
Step-by-Step Guide: Checking System Status on macOS
Mac users have powerful tools for checking system health. Apple’s macOS offers detailed diagnostics. These tools help understand your computer’s performance.
There are graphical apps and command-line tools for troubleshooting. Knowing how to use these tools can greatly improve your system checks.
Monitoring System Performance with Activity Monitor
Activity Monitor is your main tool for seeing how your system is doing. It shows how your Mac uses resources and manages processes.
To open Activity Monitor, go to Applications > Utilities or use Spotlight search. It has five main tabs: CPU, Memory, Energy, Disk, and Network.
The CPU tab shows how much processing power each process uses. Sort by “% CPU” to find out which apps are using a lot. High usage might mean a problem or a task that needs attention.
Memory monitoring shows how much memory your Mac uses. Look at the “Memory Pressure” graphs. Green means everything’s fine, but yellow or red means your memory is running low.
Energy impact shows which apps use a lot of power. This is key for laptop users who want to save battery. The Disk tab shows disk activity, and Network shows data traffic.
For ongoing problems, Activity Monitor lets you inspect processes. Select a process and click the “i” icon for more info. You can also safely quit unresponsive apps with the X button.
Employing Terminal Commands for Network Diagnostics
Terminal is for advanced users who want detailed system checks. It offers powerful commands for network and system analysis.
Start with basic tests like “ping [hostname or IP address]”. This checks if your Mac can reach external servers. It also measures response times.
For detailed network path analysis, use “traceroute: [hostname]”. It shows the path packets take to reach their destination. This helps find where network delays or failures happen.
To check network settings, use ifconfig commands. Type “ifconfig” to see all network interface details. This info is key for solving connection problems.
System performance isn’t just about the network. The “top” command gives a text-based view of system processes, like Activity Monitor. For ongoing monitoring, use “htop” if you have it. It offers colour-coded, interactive process management.
Disk utility commands include “df -h” for disk space usage. “du -sh [directory]” calculates directory sizes. This helps find large files and folders.
| Terminal Command | Primary Function | Common Use Cases |
|---|---|---|
| ping | Network connectivity testing | Checking internet access, server responsiveness |
| traceroute | Network path analysis | Identifying network bottlenecks, connection failures |
| ifconfig | Network interface configuration | Troubleshooting IP address issues, interface status |
| top | Real-time process monitoring | Identifying resource-intensive applications |
| df -h | Disk space utilisation | Checking storage capacity, identifying full volumes |
Remember, Terminal commands need exact syntax. Always check your commands before running them, even with “sudo”. These tools add depth to your Mac diagnostics when graphical tools aren’t enough.
Using Activity Monitor and Terminal together gives a full view of your system. This two-step approach helps you find and fix both simple and complex problems.
Advanced Diagnostic Techniques and Escalation Procedures
When basic troubleshooting doesn’t work, we need advanced methods to find the problem. These methods help figure out if the issue is with local systems, external services, or complex networks. They need special care.
Tools for In-Depth System Analysis
Enterprise monitoring tools offer more than just basic checks. Solutions like UptimeRobot provide advanced system diagnostics. They help oversee infrastructure in detail.
These in-depth analysis tools include checks from different places around the world. They also track how fast systems respond and test specific parts of applications. This helps find problems early.
These tools also help keep everyone informed during outages. They set up clear messages and avoid false alarms during planned maintenance. Over 2.5 million users rely on these tools for their detailed monitoring and alerts.
Recognising Limits and Contacting Professional Support
Even with the best tools, sometimes we need professional IT support. Issues with complex networks, servers, or cloud services need experts.
Today’s businesses use systems that make asking for help easy. Microsoft 365 admins can set up alerts and use a mobile app for updates. This keeps everyone informed quickly.
When you need to call for help, remember to gather important information:
- Exact error messages and when they happened
- What systems are affected and how many users
- What steps you’ve tried so far
- How urgent the problem is
Having clear escalation procedures helps get help fast. Many companies have special contacts for different services and their IT teams.
| Monitoring Feature | Basic Tools | Enterprise Solutions |
|---|---|---|
| Multi-location Checks | Limited locations | Global verification points |
| Alert Customisation | Basic notifications | White-labelled status pages |
| Response Time Tracking | Basic uptime monitoring | Performance trend analysis |
| Maintenance Management | Manual alert pausing | Scheduled maintenance windows |
Good enterprise monitoring uses advanced tools and clear plans for getting help. This way, problems get fixed quickly and complex issues get the right attention.
Conclusion
This guide shows how to check system status from quick checks to detailed diagnostics. It helps find problems reliably across various situations. By following these steps, you can solve system issues quickly and effectively.
Recent events show how important it is to watch systems closely. The mass cyber outage at airports shows how big failures can stop important services. It’s clear that having many ways to check systems is key.
Keeping systems running smoothly means always watching them. Regular checks help spot problems early. It’s best to use both automated tools and manual checks for full coverage.
Keeping systems up and running needs regular use of these checks. The main lesson is: always be ready to check and monitor. This is the heart of managing IT systems today.
FAQ
What are the most common causes of computer system downtime?
System downtime can come from many sources. This includes hardware failures, software bugs, and network issues. External problems like power outages also play a part. Knowing these causes helps fix problems quickly.
How can I quickly check if my computer’s network connection is working?
Use tools like ping tests and traceroute commands for network checks. These tools show if you’re connected to other devices or servers. Also, check your network settings and Wi-Fi signal strength for quick insights.
What local device indicators should I review when my system seems down?
Check storage, battery, app performance, and time sync. On Windows, the Security health report shows system status. On macOS, Activity Monitor helps check CPU, memory, and disk usage.
Which online resources can help verify if a system outage is widespread?
UptimeRobot offers monitoring and alerts for systems. For Microsoft services, the Service Health dashboard in the Microsoft 365 admin centre gives real-time updates. It shows if an issue is local or widespread.
How do I use Microsoft’s Service Health dashboard to check for outages?
Go to the Service Health page in the Microsoft 365 admin centre. The dashboard shows service health in a table. It indicates issues, maintenance, or normal operation. You can also set up alerts through the Microsoft 365 Admin app.
What tools should I use on Windows to diagnose system status issues?
Use Task Manager to monitor processes and resource usage. Event Viewer helps find errors in system logs. These tools help find performance problems or software conflicts.
How can macOS users check their system’s status and performance?
A> macOS users can use Activity Monitor to track usage. Terminal commands like ping, traceroute, and netstat offer detailed network diagnostics.
When should I seek professional support for system downtime?
If you can’t fix the issue yourself, or if it’s complex, contact IT support. Give them error logs and what you’ve tried. This helps them solve the problem faster.
Can I set up alerts for system outages and service status updates?
Yes, services like UptimeRobot and Microsoft’s Service Health dashboard let you set alerts. You can get emails, SMS, or push notifications for incidents or service updates.
What preventive measures can I take to minimise future system downtime?
A> Regular monitoring, updates, backups, and clear IT protocols help prevent downtime. Proactive maintenance and user training also improve system reliability.

